指标
指标是重要的测量数据,可以提供对服务的使用和性能的洞察。BentoML 提供了一组默认指标用于性能分析,同时您也可以使用 Prometheus 定义自定义指标。
在本文档中,您将了解
学习和配置 BentoML 中的默认指标
为 BentoML 服务创建自定义指标
使用 Prometheus 抓取指标
创建一个 Grafana 控制面板以可视化指标
理解指标
您可以通过 BentoML 服务的 metrics 端点访问指标。此端点默认启用,并输出 Prometheus 可以抓取的指标,以便持续监控您的服务。
默认指标
BentoML 会自动收集每个服务的一组默认指标。这些指标在不同的维度上进行跟踪,以提供对服务操作的详细可见性。
名称 |
类型 |
维度 |
|---|---|---|
|
Gauge (计量器) |
|
|
Counter (计数器) |
|
|
Histogram (直方图) |
|
|
Histogram (直方图) |
|
request_in_progress: 服务当前正在处理的请求数量。request_total: 服务已处理的总请求数量。request_duration_seconds: 处理请求所需的时间,包括请求处理总时间、已处理请求计数以及跨指定持续时间桶的分布。adaptive_batch_size: 服务执行期间使用的自适应批处理大小,这与优化批处理场景下的性能相关。您需要启用自适应批处理才能收集此指标。
指标类型
BentoML 支持 Prometheus 提供的所有指标类型。
Gauge: 表示一个可任意上下浮动的单一数值的指标。Counter: 累积指标,只增不减,用于计算总请求数。Histogram: 在可配置的桶中跟踪观察次数和观察值的总和,允许您计算平均值、百分位数等。Summary: 类似于 Histogram,但提供观察总数和观察值的总和。
有关更多信息,请参阅 Prometheus 文档。
维度
默认 BentoML 指标跟踪的维度包括
endpoint: 正在访问的特定 API 端点。runner_name: 处理请求的运行中服务的名称。service_name: 处理请求的 Bento 服务的名称。service_version: 服务的版本。http_response_code: 请求的 HTTP 响应码。worker_index: 运行推理的 worker 实例。
配置默认指标
要在 BentoML 中自定义指标的收集和报告方式,请在 @bentoml.service 装饰器中使用 metrics 参数
@bentoml.service(metrics={
    "enabled": True,
    "namespace": "custom_namespace",
})
class MyService:
    # Service implementation
enabled: 此选项默认启用。启用后,您可以通过 BentoML 服务的metrics端点访问指标。namespace: 遵循 Prometheus 的标签命名约定。默认命名空间为bentoml_service,涵盖了大多数用例。
自定义持续时间桶大小
您可以通过以下两种方式自定义 request_duration_seconds 的持续时间桶大小
手动定义桶。使用
buckets指定明确的步长@bentoml.service(metrics={ "enabled": True, "namespace": "bentoml_service", "duration": { "buckets": [0.1, 0.2, 0.5, 1, 2, 5, 10] } }) class MyService: # Service implementation
指数级桶生成。自动生成具有给定
min、max和factor值的指数级桶。min: 直方图中最小桶的下界。max: 直方图中最大桶的上界。factor: 确定桶大小的指数增长率。每个后续桶边界通过将前一个边界乘以因子来计算。
@bentoml.service(metrics={
    "enabled": True,
    "namespace": "bentoml_service",
    "duration": {
        "min": 0.1,
        "max": 10,
        "factor": 1.2
    }
})
class MyService:
    # Service implementation
注意
duration.min、duration.max和duration.factor与duration.buckets互斥。duration.factor必须大于 1,以确保每个后续桶都大于前一个。adaptive_batch_size直方图的桶是根据定义的max_batch_size计算的。桶大小从 1 开始,并以因子 2 指数级增长,直到达到max_batch_size。
默认情况下,BentoML 提供了一组优化的直方图桶,范围从 5 毫秒到 180 秒,精心分布以监控快速 API 调用和长时间运行的 LLM/GenAI 推理请求。这些桶被策略性地放置,以覆盖关键的延迟范围:快速 API 调用 (5ms-50ms)、常规 API 调用 (100ms-1s)、长时间 API 调用 (2.5s-10s) 和 LLM 推理 (30s-180s)。
创建自定义指标
您可以使用 prometheus_client API 在 BentoML 服务中定义和使用 Counter、Histogram、Summary 和 Gauge 等自定义指标。
先决条件
安装 Prometheus Python 客户端软件包。
pip install prometheus-client
定义自定义指标
要定义自定义指标,请使用 prometheus_client 模块中的指标类,并根据需要设置以下参数
name: 指标的唯一字符串标识符。documentation: 指标测量内容的描述。labelnames: 定义要应用于指标的标签字符串列表。标签为指标添加维度,对于查询和聚合非常有用。记录指标时,您需要按<metric_object>.labels(<label_name>='<label_value>').<metric_function>格式指定标签。一旦为指标定义了标签,该指标的所有实例都必须包含该标签并带有某个值。标签的值也可以是动态的,这意味着它可以根据跟踪指标的上下文而变化。例如,您可以使用标签来记录模型服务预测的版本,并且此版本标签可以随模型的更新而更改。
buckets: 直方图特有的参数,用于定义直方图桶的边界,有助于对测量范围进行分类。列表应以float('inf')结尾,以捕获所有超过最高定义边界的值。有关更多详细信息,请参阅 Prometheus 关于直方图的文档。
import bentoml
from prometheus_client import Histogram

# Define Histogram metric
inference_duration_histogram = Histogram(
    name="inference_duration_seconds",
    documentation="Time taken for inference",
    labelnames=["endpoint"],
    buckets=(
      0.005, 0.01, 0.025, 0.05,         # Fast API calls (5ms - 50ms)
      0.1, 0.25, 0.5, 1.0,              # Regular API calls (100ms - 1s)
      2.5, 5.0, 10.0,                   # Long API calls (2.5s - 10s)
      30.0, 60.0, 120.0, 180.0,         # LLM models (30s - 180s)
      float("inf"),
    ),
)

@bentoml.service
class HistogramService:
    def __init__(self) -> None:
        # Initialization code

    @bentoml.api
    def infer(self, text: str) -> str:
        # Track the metric
        inference_duration_histogram.labels(endpoint='summarize').observe(512)
        # Implementation logic
import bentoml
from prometheus_client import Counter

# Define Counter metric
inference_requests_counter = Counter(
    name="inference_requests_total",
    documentation="Total number of inference requests",
    labelnames=["endpoint"],
)

@bentoml.service
class CounterService:
    def __init__(self) -> None:
        # Initialization code

    @bentoml.api
    def infer(self, text: str) -> str:
        # Track the metric
        inference_requests_counter.labels(endpoint='summarize').inc()  # Increment the counter by 1
        # Implementation logic
import bentoml
from prometheus_client import Summary

# Define Summary metric
response_size_summary = Summary(
    name="response_size_bytes",
    documentation="Response size in bytes",
    labelnames=["endpoint"],
)

@bentoml.service
class SummaryService:
    def __init__(self) -> None:
        # Initialization code

    @bentoml.api
    def infer(self, text: str) -> str:
        # Track the metric
        response_size_summary.labels(endpoint='summarize').observe(512)
        # Implementation logic
import bentoml
from prometheus_client import Gauge

# Define Gauge metric
in_progress_gauge = Gauge(
    name="in_progress_requests",
    documentation="In-progress inference requests",
    labelnames=["endpoint"],
)

@bentoml.service
class GaugeService:
    def __init__(self) -> None:
        # Initialization code

    @bentoml.api
    def infer(self, text: str) -> str:
        # Track the metric
        in_progress_gauge.labels(endpoint='summarize').inc()  # Increment by 1
        in_progress_gauge.labels(endpoint='summarize').dec()  # Decrement by 1
        # Implementation logic
有关 prometheus_client 的更多信息,请参阅 Prometheus Python 客户端库文档。
自定义指标示例
以下 service.py 文件包含一个自定义直方图和一个计数器指标,用于测量推理时间和跟踪总请求数。
from __future__ import annotations
import bentoml
from prometheus_client import Histogram, Counter
from transformers import pipeline
import time

# Define the metrics
request_counter = Counter(
    name='summary_requests_total',
    documentation='Total number of summarization requests',
    labelnames=['status']
)

inference_time_histogram = Histogram(
    name='inference_time_seconds',
    documentation='Time taken for summarization inference',
    labelnames=['status'],
    buckets=(0.1, 0.2, 0.5, 1, 2, 5, 10, float('inf'))  # Example buckets
)

EXAMPLE_INPUT = "Breaking News: In an astonishing turn of events, the small town of Willow Creek has been taken by storm as local resident Jerry Thompson's cat, Whiskers, performed what witnesses are calling a 'miraculous and gravity-defying leap.' Eyewitnesses report that Whiskers, an otherwise unremarkable tabby cat, jumped a record-breaking 20 feet into the air to catch a fly. The event, which took place in Thompson's backyard, is now being investigated by scientists for potential breaches in the laws of physics. Local authorities are considering a town festival to celebrate what is being hailed as 'The Leap of the Century."

@bentoml.service(
    resources={"cpu": "2"},
    traffic={"timeout": 10},
)
class Summarization:
    def __init__(self) -> None:
        self.pipeline = pipeline('summarization')

    @bentoml.api
    def summarize(self, text: str = EXAMPLE_INPUT) -> str:
        start_time = time.time()
        try:
            result = self.pipeline(text)
            summary_text = result[0]['summary_text']
            # Capture successful requests
            status = 'success'
        except Exception as e:
            # Capture failures
            summary_text = str(e)
            status = 'failure'
        finally:
            # Measure how long the inference took and update the histogram
            inference_time_histogram.labels(status=status).observe(time.time() - start_time)
            # Increment the request counter
            request_counter.labels(status=status).inc()

        return summary_text
在本地运行此服务
bentoml serve
确保您已向 summarize 端点发送了一些请求,然后运行以下命令查看自定义指标。您需要将 inference_time_seconds 和 summary_requests_total 替换为您自己的指标名称。
curl -X 'GET' 'https://:3000/metrics' -H 'accept: */*' | grep -E 'inference_time_seconds|summary_requests_total'
预期输出
# HELP summary_requests_total Total number of summarization requests
# TYPE summary_requests_total counter
summary_requests_total{status="success"} 12.0
# HELP inference_time_seconds Time taken for summarization inference
# TYPE inference_time_seconds histogram
inference_time_seconds_sum{status="success"} 51.74311947822571
inference_time_seconds_bucket{le="0.1",status="success"} 0.0
inference_time_seconds_bucket{le="0.2",status="success"} 0.0
inference_time_seconds_bucket{le="0.5",status="success"} 0.0
inference_time_seconds_bucket{le="1.0",status="success"} 0.0
inference_time_seconds_bucket{le="2.0",status="success"} 0.0
inference_time_seconds_bucket{le="5.0",status="success"} 12.0
inference_time_seconds_bucket{le="10.0",status="success"} 12.0
inference_time_seconds_bucket{le="+Inf",status="success"} 12.0
inference_time_seconds_count{status="success"} 12.0
使用 Prometheus 抓取指标
您可以集成 Prometheus 来抓取和可视化 BentoML 服务中的默认指标和自定义指标。
创建一个 Prometheus 配置文件来定义抓取作业。这是一个每 5 秒从 BentoML 服务抓取指标的示例。
prometheus.yml¶global: scrape_interval: 5s evaluation_interval: 15s scrape_configs: - job_name: prometheus metrics_path: "/metrics" # The metrics endpoint of the BentoML Service static_configs: - targets: ["0.0.0.0:3000"] # The address where the BentoML Service is running
确保您有一个 BentoML 服务正在运行,然后在另一个终端会话中使用您创建的配置文件启动 Prometheus
./prometheus --config.file=/path/to/the/file/prometheus.yml
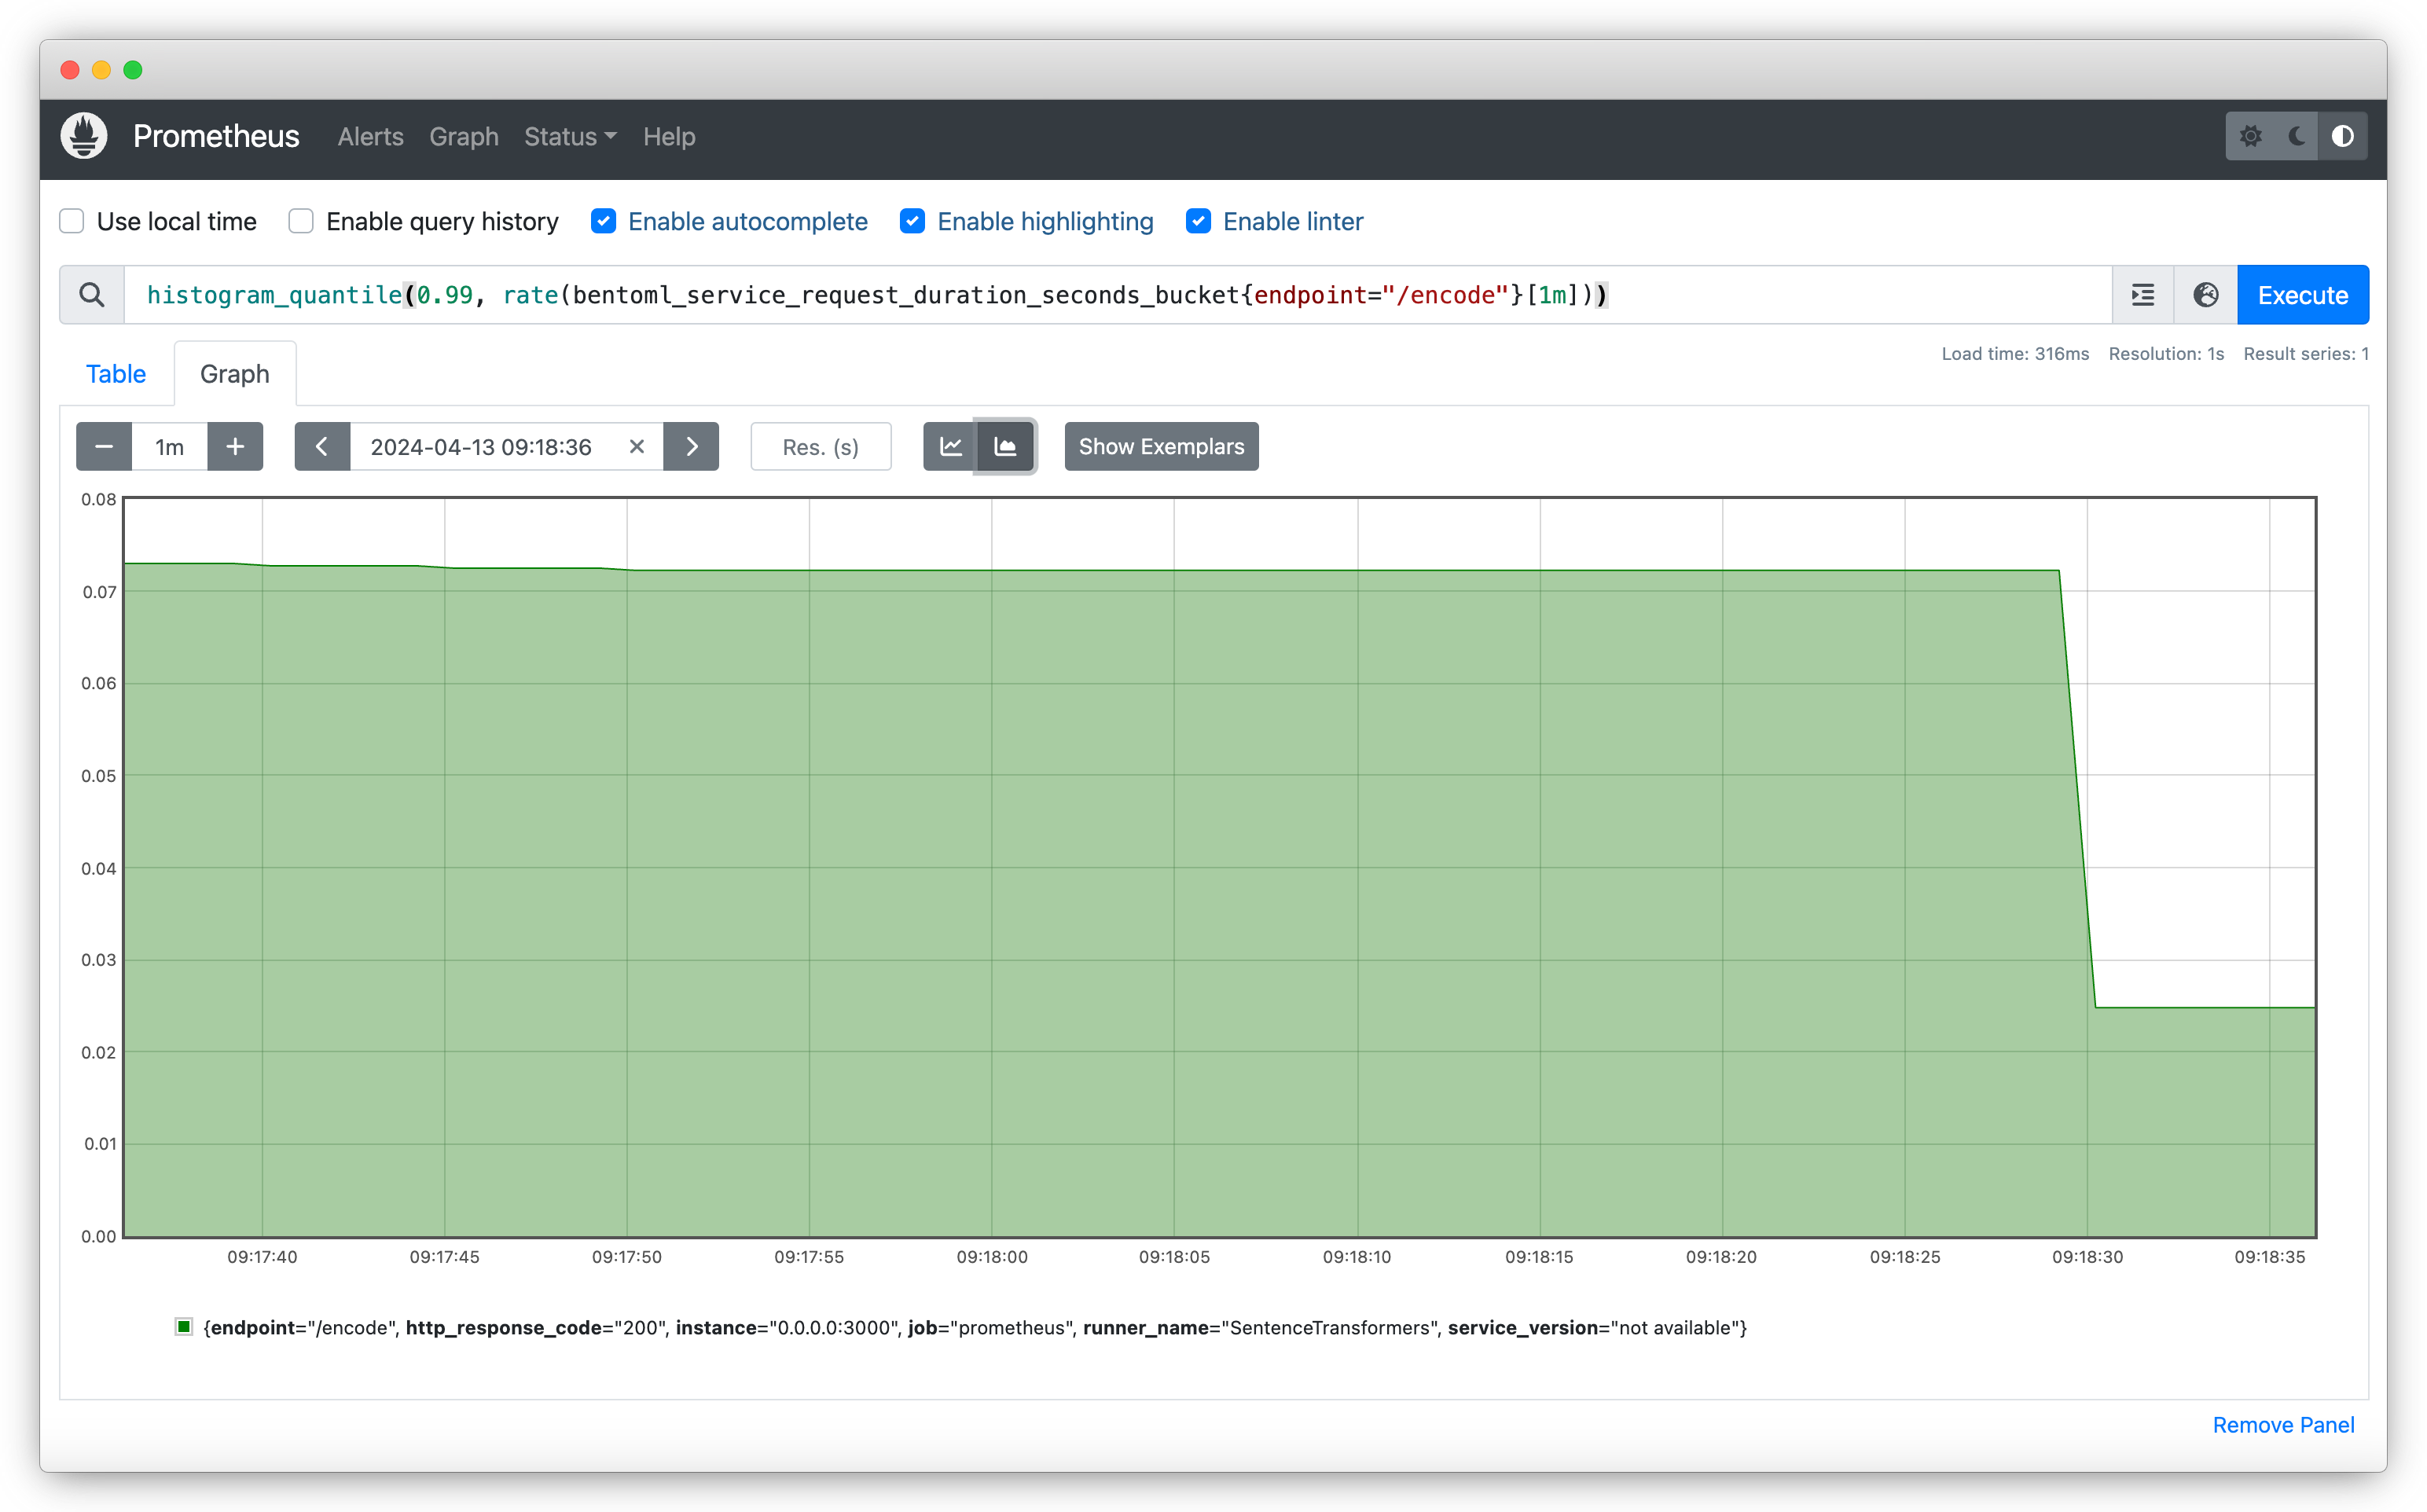
Prometheus 运行后,在您的网络浏览器中访问
https://:9090以访问其 Web UI。此界面允许您查询和可视化从 BentoML 服务收集的指标。使用PromQL 表达式来查询和可视化指标。例如,要获取最近一分钟内对
/encode端点请求持续时间的第 99 百分位数,请使用histogram_quantile(0.99, rate(bentoml_service_request_duration_seconds_bucket{endpoint="/encode"}[1m]))
创建 Grafana 控制面板
Grafana 是一个分析平台,允许您创建动态且信息丰富的控制面板来可视化 BentoML 指标。执行以下步骤创建 Grafana 控制面板。
默认情况下,Grafana 运行在端口
3000上,这与 BentoML 的默认端口冲突。为避免此问题,请更改 Grafana 的默认端口。例如sudo nano /etc/grafana/grafana.ini
找到
[http]部分并将http_port更改为未被占用的端口,例如4000;http_port = 3000 # Change it to a port of your choice and uncomment the line by removing the semicolon http_port = 4000
保存文件并重新启动 Grafana 以应用更改
sudo systemctl restart grafana-server
在
https://:4000/(请使用您自己的端口) 访问 Grafana Web UI。使用默认凭据 (admin/admin) 登录。在 Grafana 顶部的搜索框中,输入
Data sources并将 Prometheus 添加为一个可用选项。在 Connection 中,将 URL 设置为您正在运行的 Prometheus 实例的地址,例如https://:9090。保存配置并测试连接,以确保 Grafana 可以从 Prometheus 中检索数据。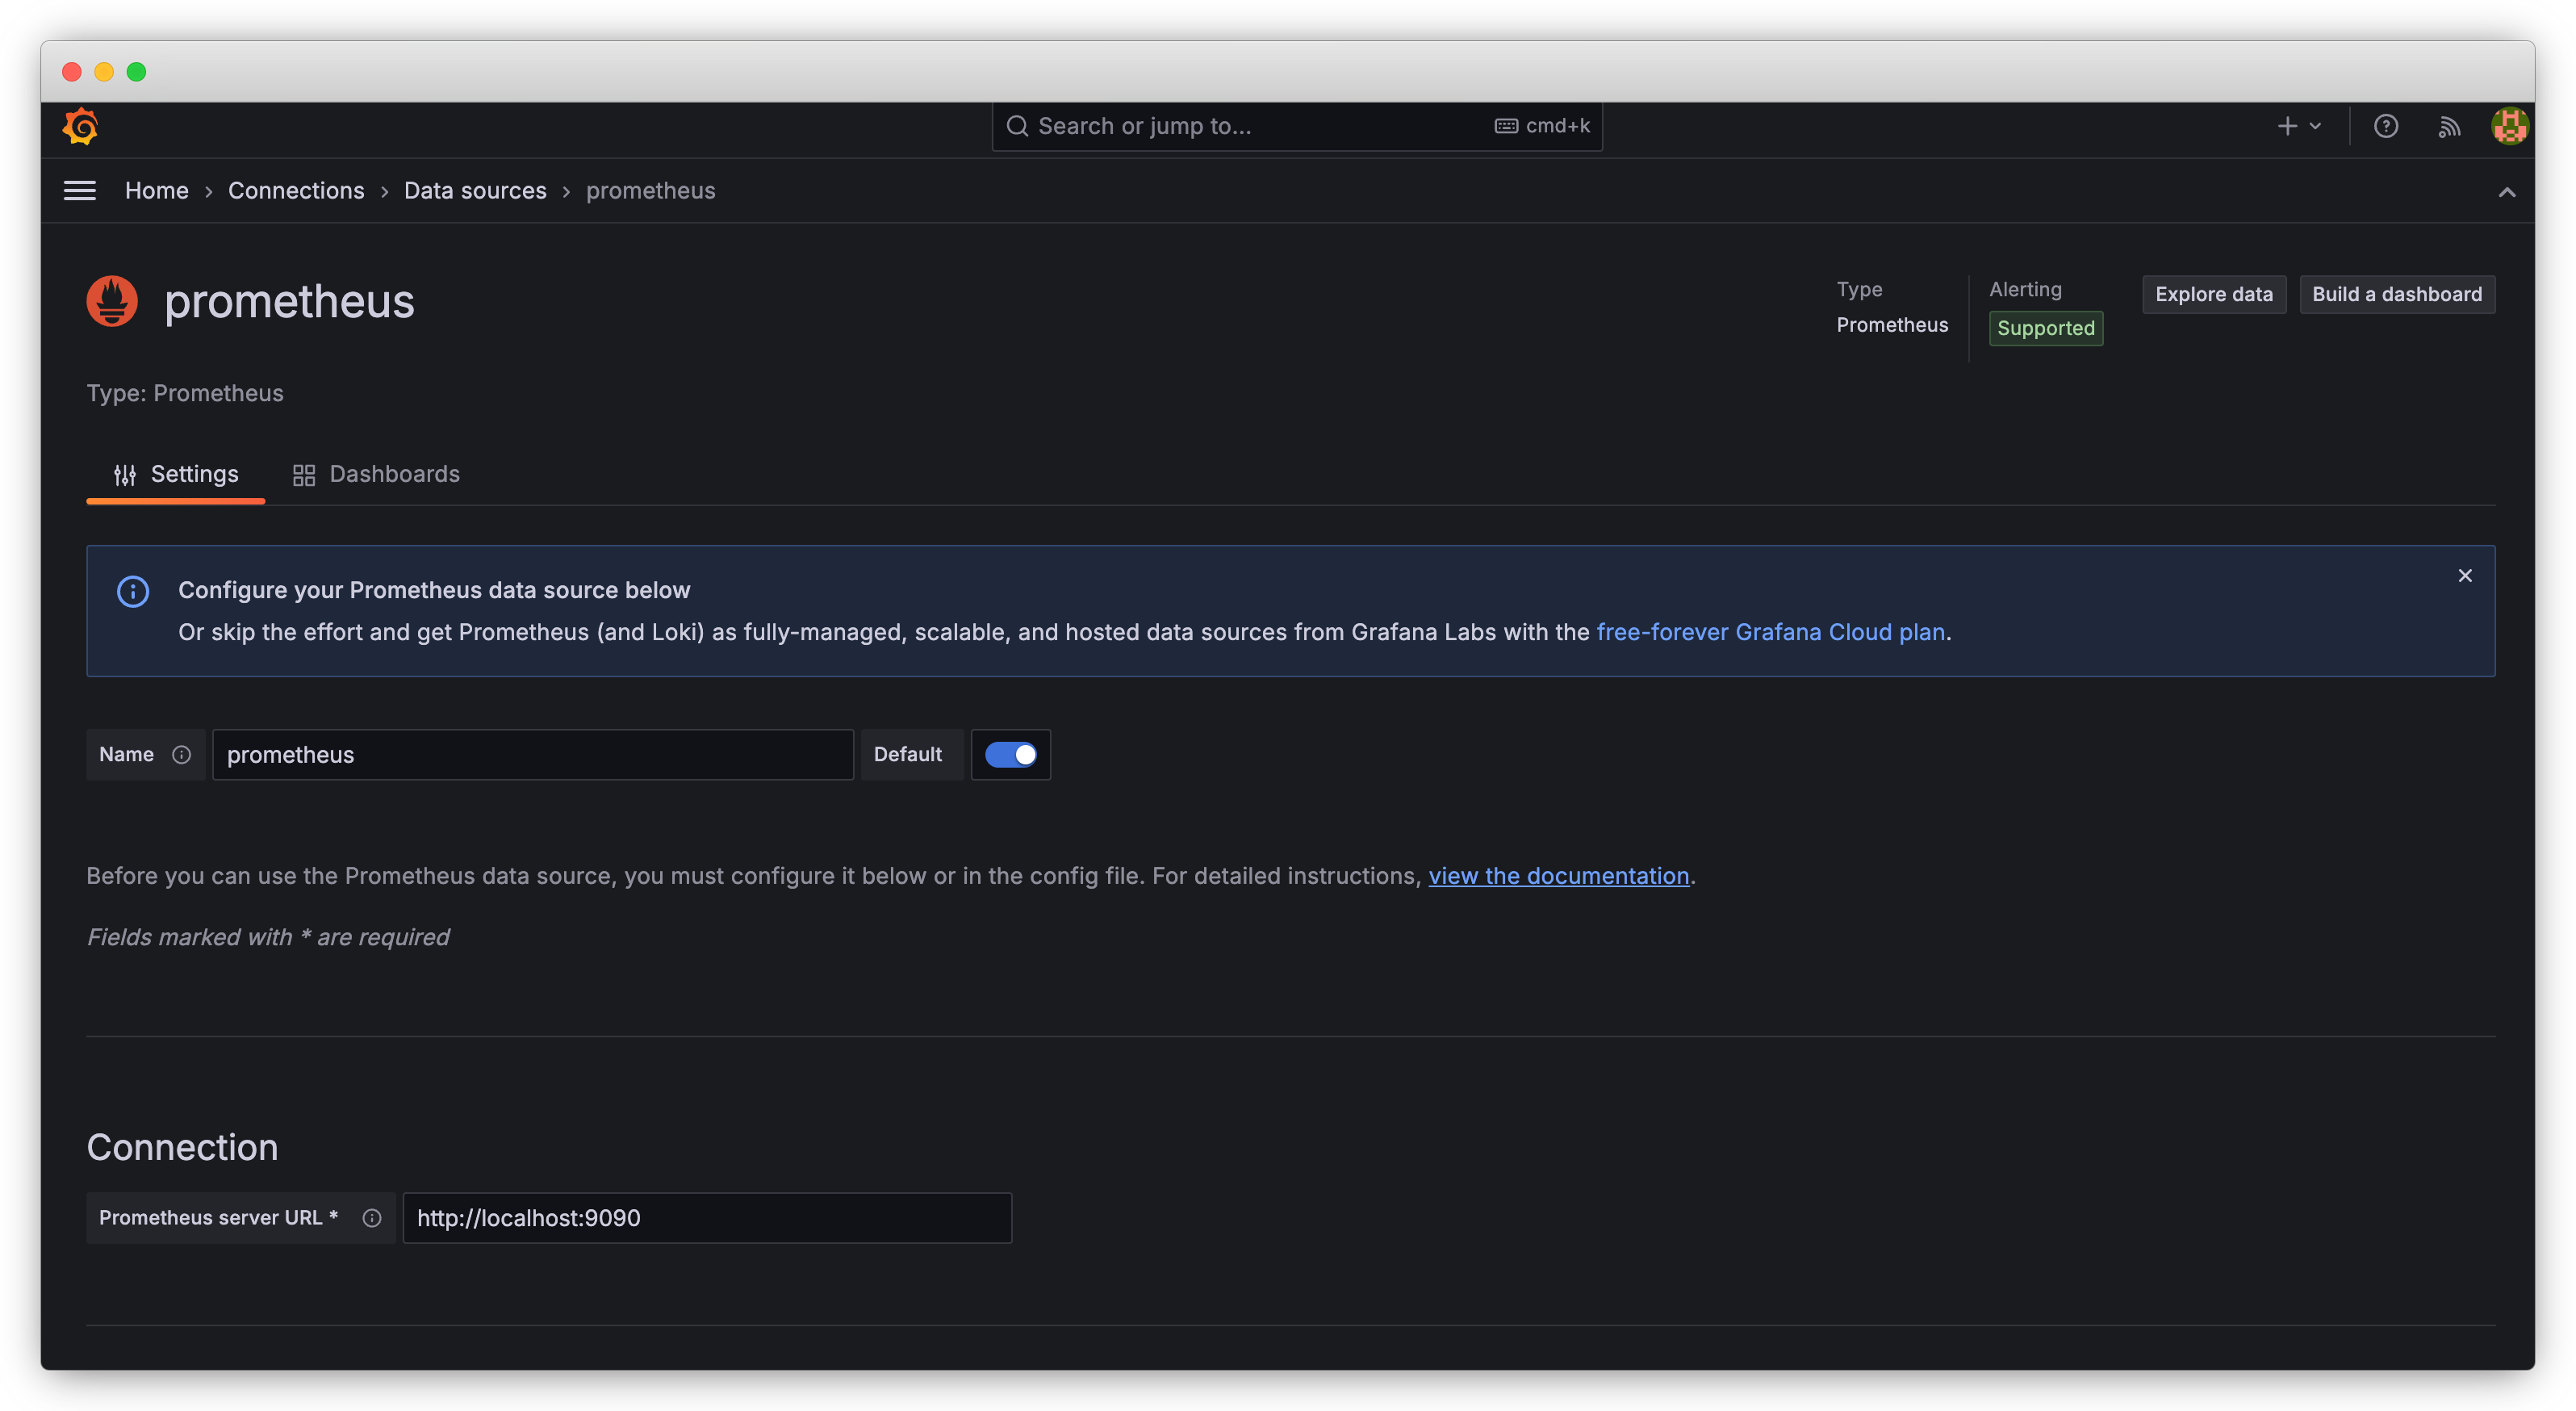
将 Prometheus 配置为数据源后,您可以创建一个新的控制面板。首先添加一个面板并选择要可视化的指标,例如
bentoml_service_request_duration_seconds_bucket。Grafana 提供各种可视化选项,从简单的折线图到更复杂的表示形式,如热力图或仪表盘。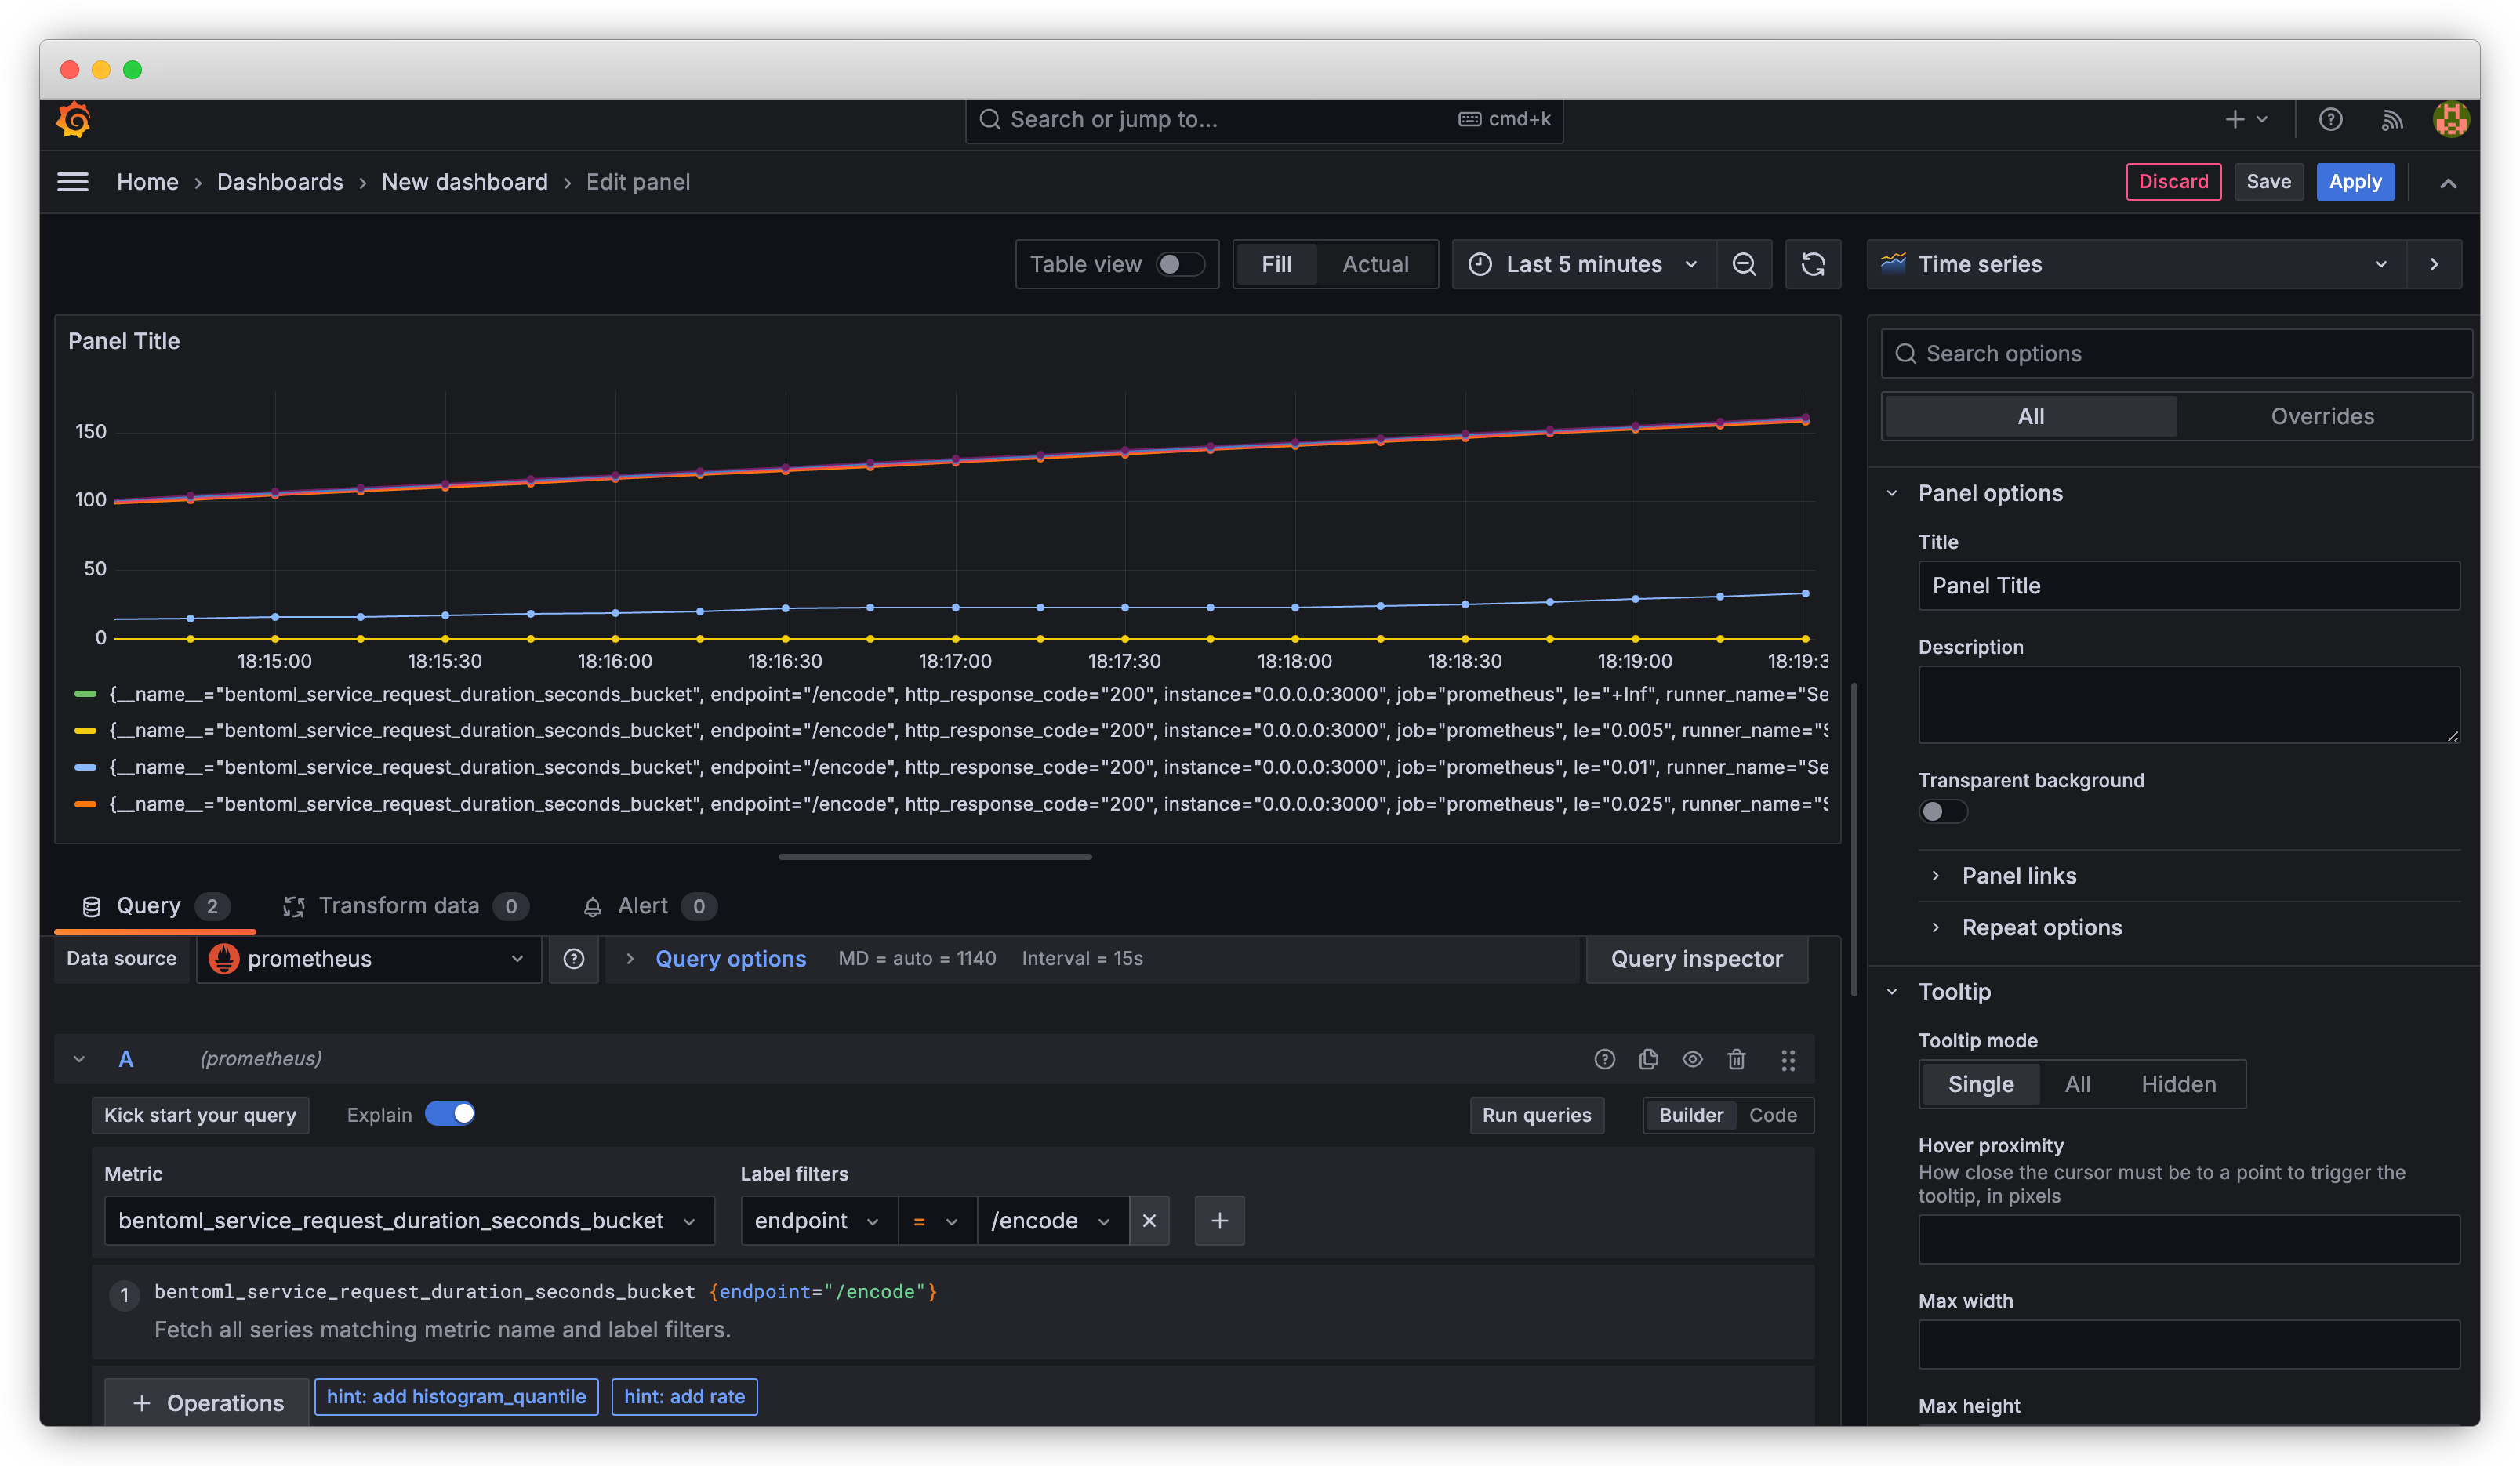
有关创建和自定义控制面板的详细说明,请阅读Grafana 文档。