追踪
追踪提供了应用程序行为的持续视图,跟踪数据在应用程序不同组件中的流动。BentoML 通过 OpenTelemetry 提供内置的追踪支持,允许用户使用 Zipkin、Jaeger 和 OTLP 导出器导出追踪数据。
本文档解释了如何在 BentoML 中配置追踪。
为什么需要追踪?
在生产环境中调试模型和服务可能具有挑战性。传统的日志记录方法在跨多个服务或组件跟踪问题时往往力不从心。此外,仅靠日志可能无法提供足够的上下文或信息来确定问题的根本原因。
另一方面,追踪提供了几个关键优势
全面的可见性:追踪提供了应用程序流程的整体视图,允许开发人员跟踪请求在各个组件中的移动。
性能监控:追踪通过显示应用程序中时间花费的位置来帮助识别性能瓶颈。
跨服务关联:追踪有助于跨多个服务跟踪请求,这在分布式系统和微服务架构中非常有用。
安装依赖项
在 BentoML 中配置追踪之前,请安装相应的软件包。
pip install "bentoml[tracing-zipkin]"
pip install "bentoml[tracing-jaeger]"
pip install "bentoml[tracing-otlp]"
配置导出器
您可以使用 @bentoml.service 装饰器中的 tracing 字段为 BentoML 服务配置追踪导出器,在此您可以定义一些通用配置,然后是每种导出器类型的特定配置。
通用配置是导出器之间共享的值,这意味着它们将通过 exporter_type 应用于相应的导出器集。示例如下
import bentoml

@bentoml.service(
    resources={"cpu": "2"},
    traffic={"timeout": 10},
    tracing={
        # Common configurations
        "exporter_type": "jaeger",
        "sample_rate": 1.0,
        "timeout": 5,
        "max_tag_value_length": 256,
        "excluded_urls": "readyz",
        "jaeger": {
            # Specific configurations of the exporter
    }
)
class MyService:
   # Service implementation code
tracing 中的可用字段
exporter_type:用于服务的追踪导出器。支持的值包括jaeger、zipkin和otlp。sample_rate:默认情况下不收集任何追踪。将sample_rate设置为您期望的比例以开始收集追踪。timeout:导出器的超时时间,它等待每个批次导出完成。max_tag_value_length:字符串属性值的最大长度。excluded_urls:从追踪中排除路由。此参数可以是逗号分隔的路由字符串,也可以是字符串列表。
注意
BentoML 实现了 OpenTelemetry API,这意味着 OpenTelemetry 环境变量将优先于在 @bentoml.service 装饰器中设置的配置。
Zipkin
使用 Zipkin 时,BentoML 仅支持其 V2 协议。如果您直接向 OpenZipkin 服务器报告,请将 URL 路径 /api/v2/spans 添加到服务器地址。
以下是使用 Zipkin 作为追踪导出器的示例
import bentoml

@bentoml.service(
    resources={"cpu": "2"},
    traffic={"timeout": 60},
    tracing={
        "exporter_type": "zipkin",
        "sample_rate": 1.0,
        "zipkin": {
            "endpoint": "https://:9411/api/v2/spans",
            "local_node_ipv4": "192.168.0.1",
            "local_node_ipv6": "2001:db8::c001",
            "local_node_port": 31313,
        }
   }
)
class MyService:
    # Service implementation code
Zipkin 的可用字段,这些字段通过 OpenTelemetry Zipkin 导出器传递
endpoint:发送 Zipkin span 的端点 URL。local_node_ipv4:本地节点的 IPv4 地址。local_node_ipv6:本地节点的 IPv6 地址。local_node_port:本地节点的端口。
配置好您的 BentoML 服务后,在启动服务之前运行 Zipkin。例如,运行最新的 Zipkin Docker 镜像如下
docker run -d -p 9411:9411 openzipkin/zipkin
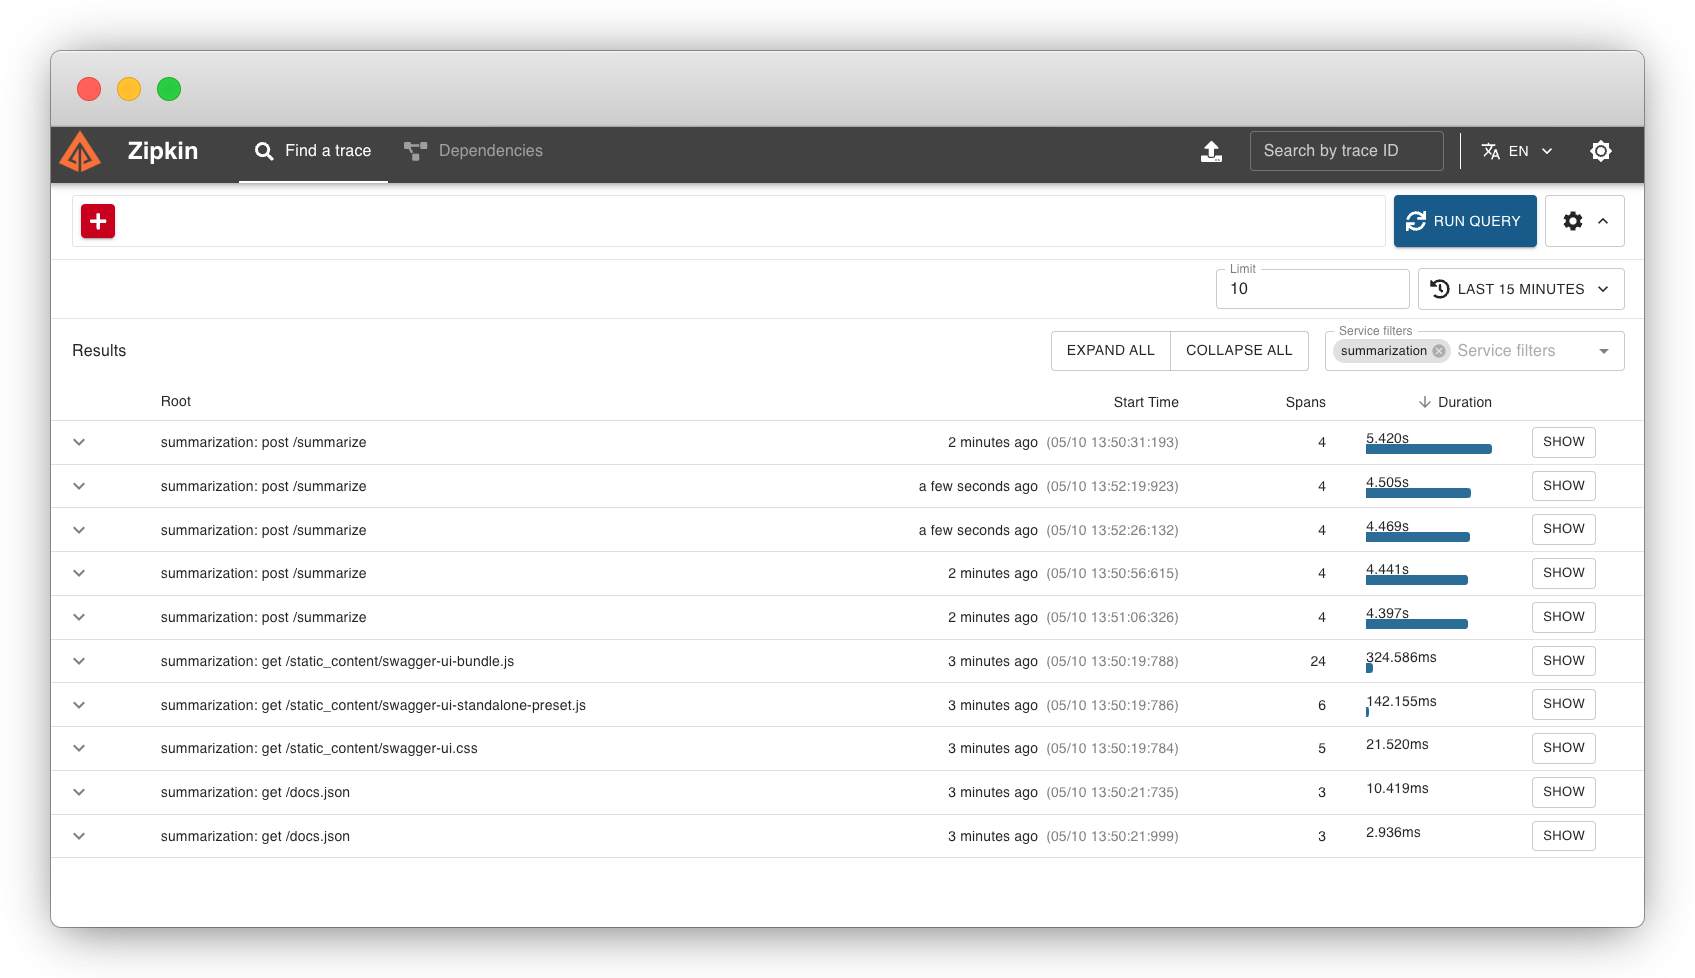
启动您的 BentoML 服务并向其发送一些请求。然后,您可以访问 Zipkin UI ( https://:9411/ ) 查看追踪数据。
Jaeger
BentoML 允许您使用 Jaeger 通过 Thrift 协议收集追踪数据。
注意
当无法在应用程序旁边部署 Jaeger Agent 时(例如,当应用程序代码作为 Lambda 函数运行时),可以将 Collector 配置为通过 HTTP 使用 Thrift 发送 span。如果同时配置了 Agent 和 Collector,则导出器仅将追踪数据发送到 Collector,以消除重复条目。
以下是使用 Jaeger 作为追踪导出器的示例
import bentoml

@bentoml.service(
    resources={"cpu": "2"},
    traffic={"timeout": 60},
    tracing={
        "exporter_type": "jaeger",
        "sample_rate": 1.0,
        "jaeger": {
            "protocol": "thrift",
            "collector_endpoint": "https://:14268/api/traces?format=jaeger.thrift",
            "thrift": {
                "agent_host_name": "localhost",
                "agent_port": 6831,
                "udp_split_oversized_batches": True,
            }
        }
    }
)
class MyService:
    # Service implementation code
Jaeger 的可用字段
protocol:Jaeger 使用的协议。collector_endpoint:Jaeger collector 端点的 URL。thrift:包含 Thrift 协议特定配置的字典。agent_host_name:Jaeger Agent 的主机名,追踪数据将发送到此地址。agent_port:Jaeger Agent 监听传入追踪数据的端口。udp_split_oversized_batches:当设置为True时,如果给定的缓冲区大于 UDP 最大数据包大小(默认值:65000),则超大的批次将被分割成小于 UDP 最大数据包大小的小批次。
\[\text{packets} \triangleq \left\lceil \frac{\text{len}(\text{buff})}{\text{max_packet_size}} \right\rceil\]
配置好您的 BentoML 服务后,在启动服务之前运行 Jaeger。例如,您可以运行 Jaeger all-in-one Docker 镜像如下
docker run --rm --name jaeger \
  -e COLLECTOR_ZIPKIN_HOST_PORT=:9411 \
  -p 6831:6831/udp \
  -p 6832:6832/udp \
  -p 5778:5778 \
  -p 16686:16686 \
  -p 4317:4317 \
  -p 4318:4318 \
  -p 14250:14250 \
  -p 14268:14268 \
  -p 14269:14269 \
  -p 9411:9411 \
  jaegertracing/all-in-one:1.57
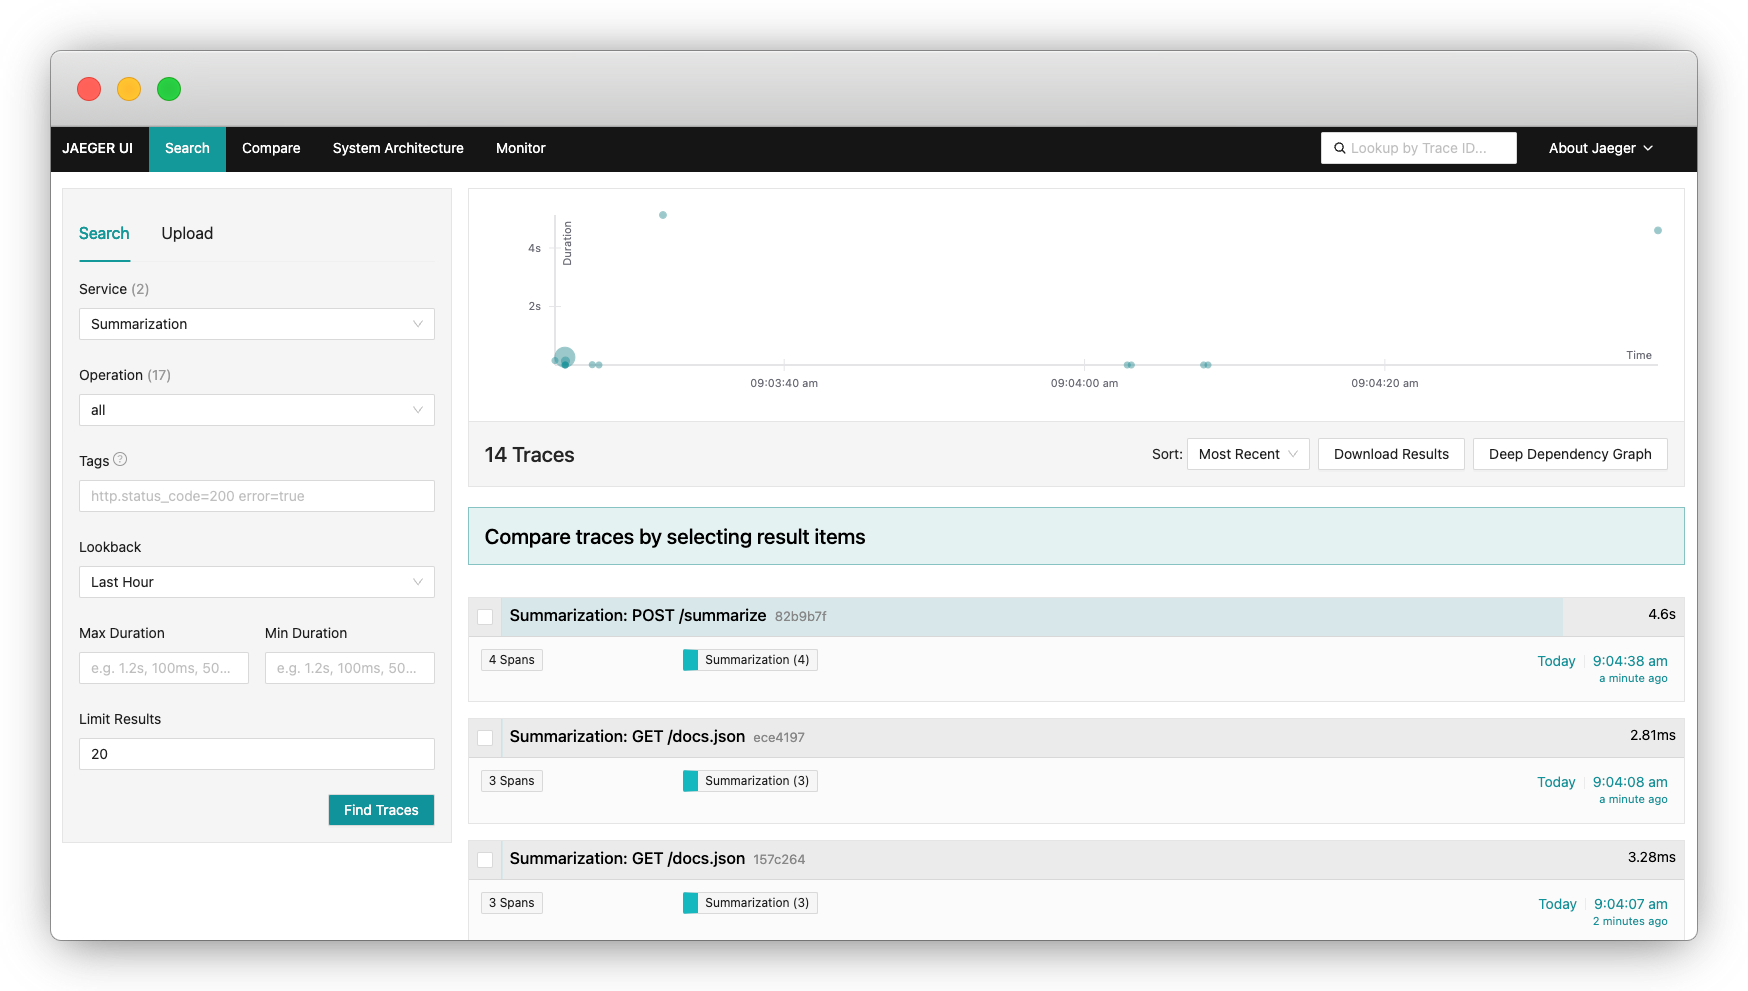
启动您的 BentoML 服务并向其发送一些请求。然后,您可以访问 Jaeger UI ( https://:16686/ ) 查看追踪数据。
OTLP 导出器
BentoML 支持 OTLP 导出器,以便轻松与 OpenTelemetry traces receiver 集成。目前,BentoML 的 OTLP 导出器仅支持 HTTP 协议,该协议使用 Protobuf 通过 HTTP 发送追踪数据。
以下是使用 OTLP 导出器的示例
import bentoml

@bentoml.service(
    resources={"cpu": "2"},
    traffic={"timeout": 60},
    tracing={
        "exporter_type": "otlp",
        "sample_rate": 1.0,
        "otlp": {
            "protocol": "http",
            "endpoint": "https://:4318/v1/traces",
            "http": {
                "certificate_file": "/path/to/cert.pem",
                "headers": {
                    "Keep-Alive": "timeout=5, max=1000",
                },
            },
        }
    }
)
class MyService:
...
OTLP 的可用字段
protocol:OTLP 使用的协议。endpoint:发送 OTLP span 的端点 URL,即 OpenTelemetry receiver 的地址。http:包含 HTTP 协议特定配置的字典。certificate_file:用于安全 HTTP 通信的证书文件路径。headers:包含自定义 HTTP 头部的字典,这些头部将包含在追踪请求中。
要启动 OTLP 导出器,您通常需要运行一个 OpenTelemetry Collector,它可以接收、处理并将遥测数据(追踪、指标、日志等)导出到所需的后端。您可以在其 GitHub 仓库中找到最新的 OpenTelemetry Collector 版本,或者阅读其快速入门指南。
最快的方法是直接运行最新的 Docker 镜像,并将追踪信息输出到单独的文件中
docker run \
  -p 127.0.0.1:4318:4318 \
  otel/opentelemetry-collector:0.100.0 \
  2>&1 | tee collector-output.txt
在另一个终端中,启动配置了 otlp 追踪的 BentoML 服务,并向其发送一些请求。然后,您可以查看由 OpenTelemetry Collector 收集和处理的追踪详情。
...
Resource SchemaURL:
Resource attributes:
     -> telemetry.sdk.language: Str(python)
     -> telemetry.sdk.name: Str(opentelemetry)
     -> telemetry.sdk.version: Str(1.20.0)
     -> service.name: Str(Summarization)
     -> service.instance.id: Int(1)
     -> service.version: Str(not available)
ScopeSpans #0
ScopeSpans SchemaURL:
InstrumentationScope opentelemetry.instrumentation.asgi 0.41b0
Span #0
    Trace ID       : 55f76a6172e5ef154bef3024cb7244a4
    Parent ID      : 80ebf4a29195d793
    ID             : 60bb910352f8279d
    Name           : POST /summarize http send
    Kind           : Internal
    Start time     : 2024-05-10 06:14:04.614485867 +0000 UTC
    End time       : 2024-05-10 06:14:04.614835736 +0000 UTC
    Status code    : Unset
    Status message :
Attributes:
     -> http.status_code: Int(200)
     -> type: Str(http.response.start)
Span #1
    Trace ID       : 55f76a6172e5ef154bef3024cb7244a4
    Parent ID      : 80ebf4a29195d793
    ID             : 027802ac3a807e5a
    Name           : POST /summarize http send
    Kind           : Internal
    Start time     : 2024-05-10 06:14:04.615378986 +0000 UTC
    End time       : 2024-05-10 06:14:04.615539025 +0000 UTC
    Status code    : Unset
    Status message :
Attributes:
     -> type: Str(http.response.body)
Span #2
    Trace ID       : 55f76a6172e5ef154bef3024cb7244a4
    Parent ID      :
    ID             : 80ebf4a29195d793
    Name           : POST /summarize
    Kind           : Server
    Start time     : 2024-05-10 06:13:59.653244649 +0000 UTC
    End time       : 2024-05-10 06:14:04.615805503 +0000 UTC
    Status code    : Unset
    Status message :
Attributes:
     -> http.scheme: Str(http)
     -> http.host: Str(xx.x.xxx.x:3000)
     -> net.host.port: Int(3000)
     -> http.flavor: Str(1.1)
     -> http.target: Str(/summarize)
     -> http.url: Str(http://xx.x.xxx.x:3000/summarize)
     -> http.method: Str(POST)
     -> http.server_name: Str(xxx.xxx.xx.xxx:3000)
     -> http.user_agent: Str(Mozilla/5.0 (Macintosh; Intel Mac OS X 10_15_7) AppleWebKit/537.36 (KHTML, like Gecko) Chrome/124.0.0.0 Safari/537.36)
     -> net.peer.ip: Str(xxx.xxx.xx.xx)
     -> net.peer.port: Int(59482)
     -> http.status_code: Int(200)
        {"kind": "exporter", "data_type": "traces", "name": "debug"}
2024-05-10T06:14:06.875Z        info    MetricsExporter {"kind": "exporter", "data_type": "metrics", "name": "debug", "resource metrics": 1, "metrics": 22, "data points": 22}
2024-05-10T06:14:06.875Z        info    ResourceMetrics #0
...
注意
OTLP 不包含 UI 组件。要可视化 OTLP 数据,您需要使用支持 OTLP 并提供 UI 的后端,例如 Jaeger 或 Zipkin。